Find steady baskets of stocks, and test them before you invest
Quant Lab is the research workspace inside CapLens. It builds small groups of stocks that hold up well in market falls, tries hard to break them, and tells you whether now is a sensible time to buy.
What Quant Lab does, without the jargon
Quant Lab answers one question: which group of stocks could I hold calmly for years, and is now a sensible time to buy it?
What is a basket?
A basket is a small group of stocks held together with set weights, like a home-made ETF. You choose the rules; Quant Lab finds the combinations that fit them.
What is “defensive”?
A defensive basket falls less in bad markets, spends less time below its previous high and recovers faster. Quant Lab scores every basket on exactly that.
Why the testing?
Any strategy can look good on one backtest. Quant Lab then tries to break each basket with tests it was not tuned for, and says plainly when the evidence is thin.
Follow one idea through five questions
1. Which stocks deserve a look?
Screener. Rank thousands of listings on value, quality, past falls and trend, and keep the ones you like.
2. Which combination holds up best?
Defensive Baskets. Set your rules, such as maximum weight per sector, and get a ranked list of baskets.
3. Can I trust that result?
Trust report. Seven checks, including a test on data the basket never saw, different market environments and trading costs.
4. Is now a good time?
Deployment analysis. Compares today with similar past entries and shows how long they took to pay off.
5. How much of each?
Allocation and rebalance. Turns the basket into exact amounts per stock, with the reason for each weight.
From thousands of listings to a deployment plan
Screen
Rank the universe on valuation, quality, drawdown, volatility and trend. Export or hand names to the next stage.
Discover
Generate all-sector or defensive-only baskets with caps on sector, single name, correlation and PE.
Validate
Out-of-sample, walk-forward, regime, bias and execution tests, plus stress events and a deployment verdict.
Deploy
Entry readiness, staged deployment plan, allocation, rebalance preview and ongoing drawdown watch.
The research tools, in one workspace
Stock Screener
Rank thousands of names with server-side filters, then narrow the grid column by column.
Mean Reversion
Find stocks that pull back in a controlled way and recover with repeatable discipline.
Defensive Baskets
Auto-discover ETF-like baskets ranked on survivability and psychological stability.
Custom Basket Lab
Pick your own stocks, set weighting and rebalance rules, and get the same survivability analysis.
Bucket Builder
Persist a basket as a saved bucket and track it through time.
Strategy Backtester
Backtest a rule set or a saved bucket, with equity curve, drawdown and trust validation.
Risk Analyzer and Factor Rankings
Review risk behaviour and factor rank for the names you are considering.
Jobs and Monitor
Heavy analyses run in the background, with progress, status and API telemetry.
You set the rules. Quant Lab finds the baskets.
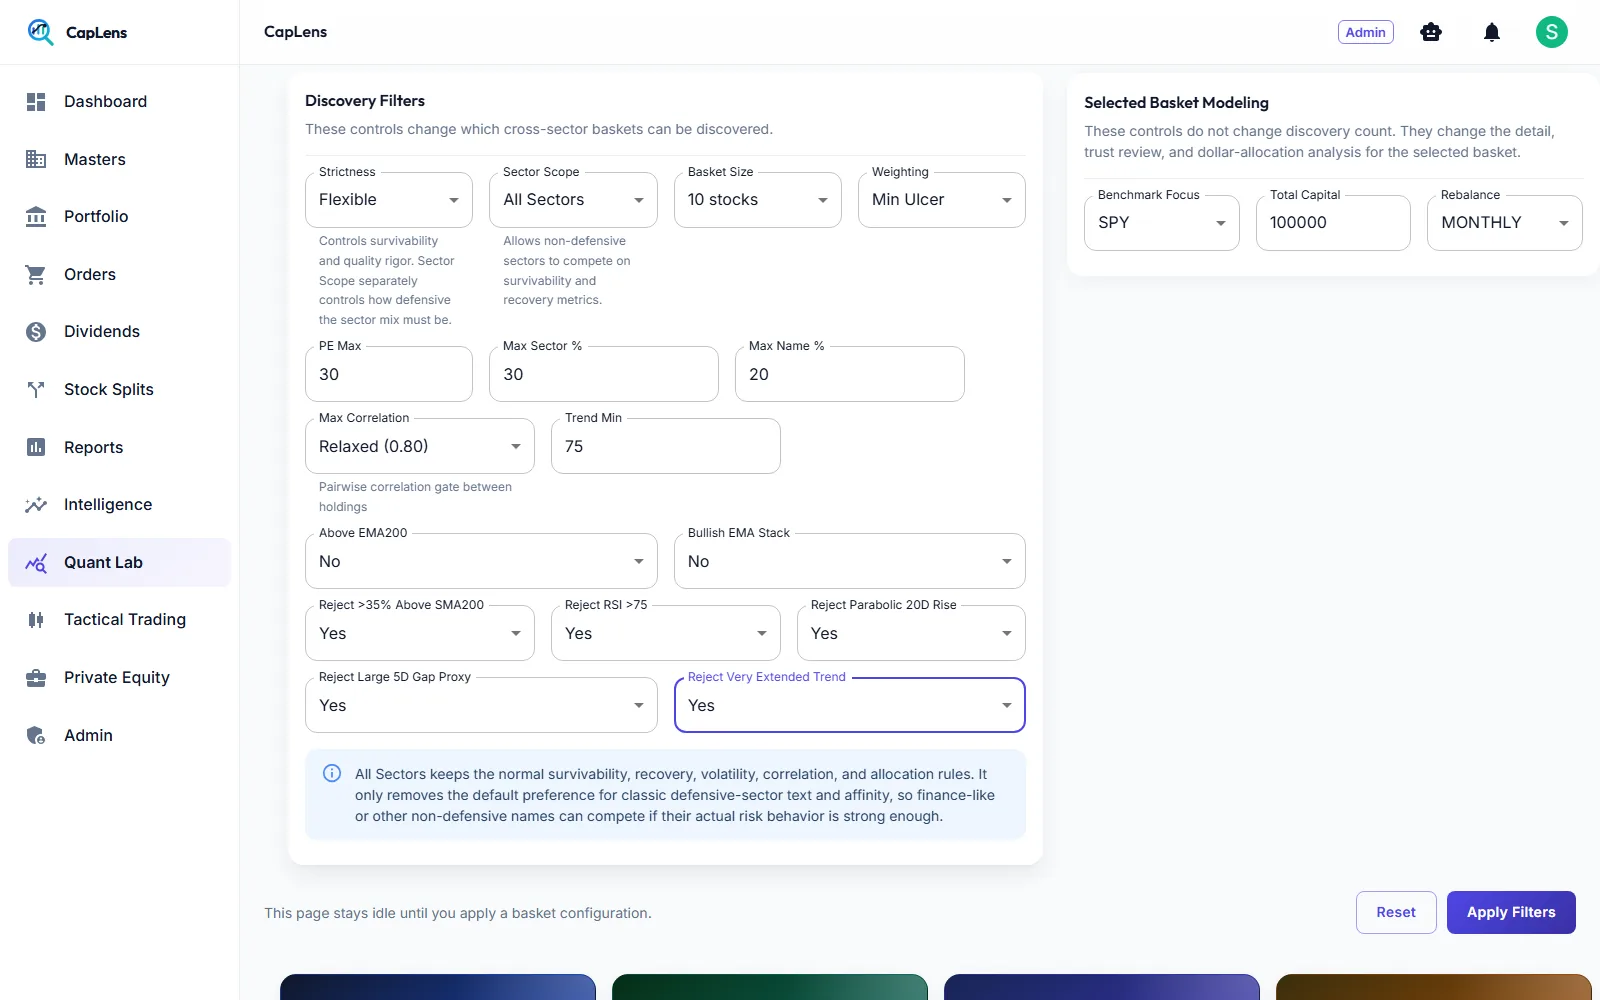
Every constraint is explicit and visible, so a basket can be explained to an investment committee.
- Strictness: how rigorous the survivability and quality screen is
- Sector scope: defensive only, or all sectors competing on risk behaviour
- Basket size and weighting: equal, inverse volatility, risk parity, minimum ulcer and more
- Guard rails: maximum PE, sector weight, single-name weight and pairwise correlation
- Trend and rejection rules: minimum trend score, EMA stack, RSI, parabolic and gap filters
Compare baskets on what matters to a cautious investor
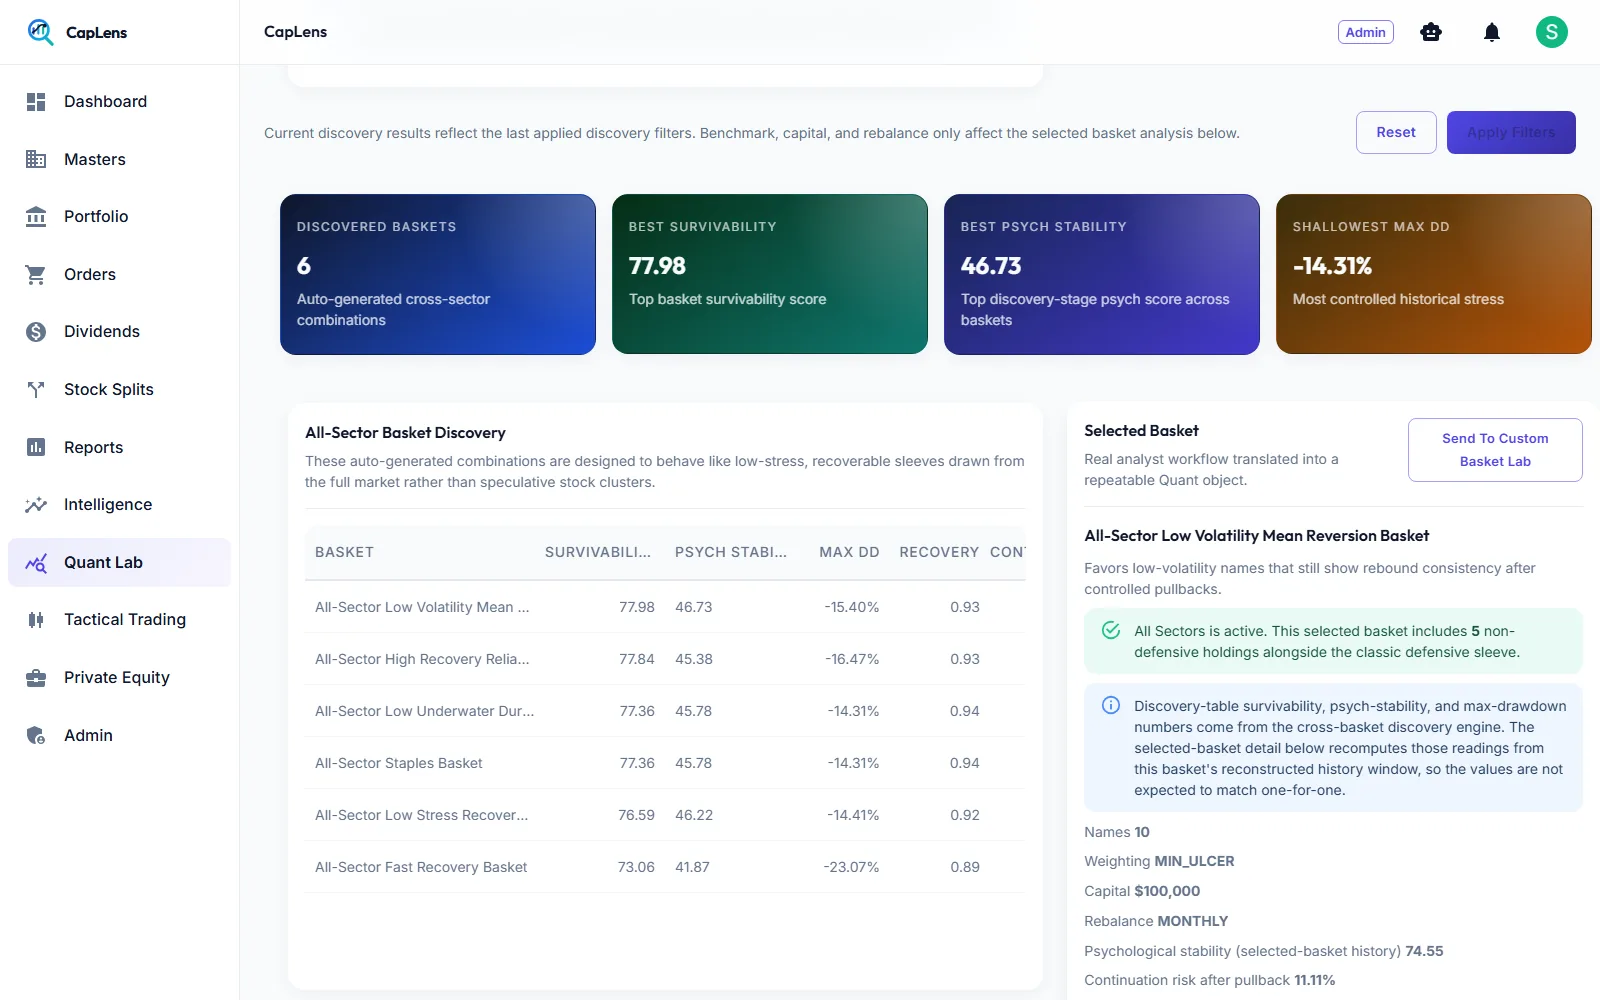
Each discovered basket is ranked by survivability, psychological stability, maximum drawdown, recovery, continuation risk and weighted PE, with its sector mix and how many holdings are non-defensive. Open any row to see its holdings, weights and fundamentals.
Because discovery and detail views are computed on different windows, CapLens states clearly that their numbers are not expected to match one-for-one.
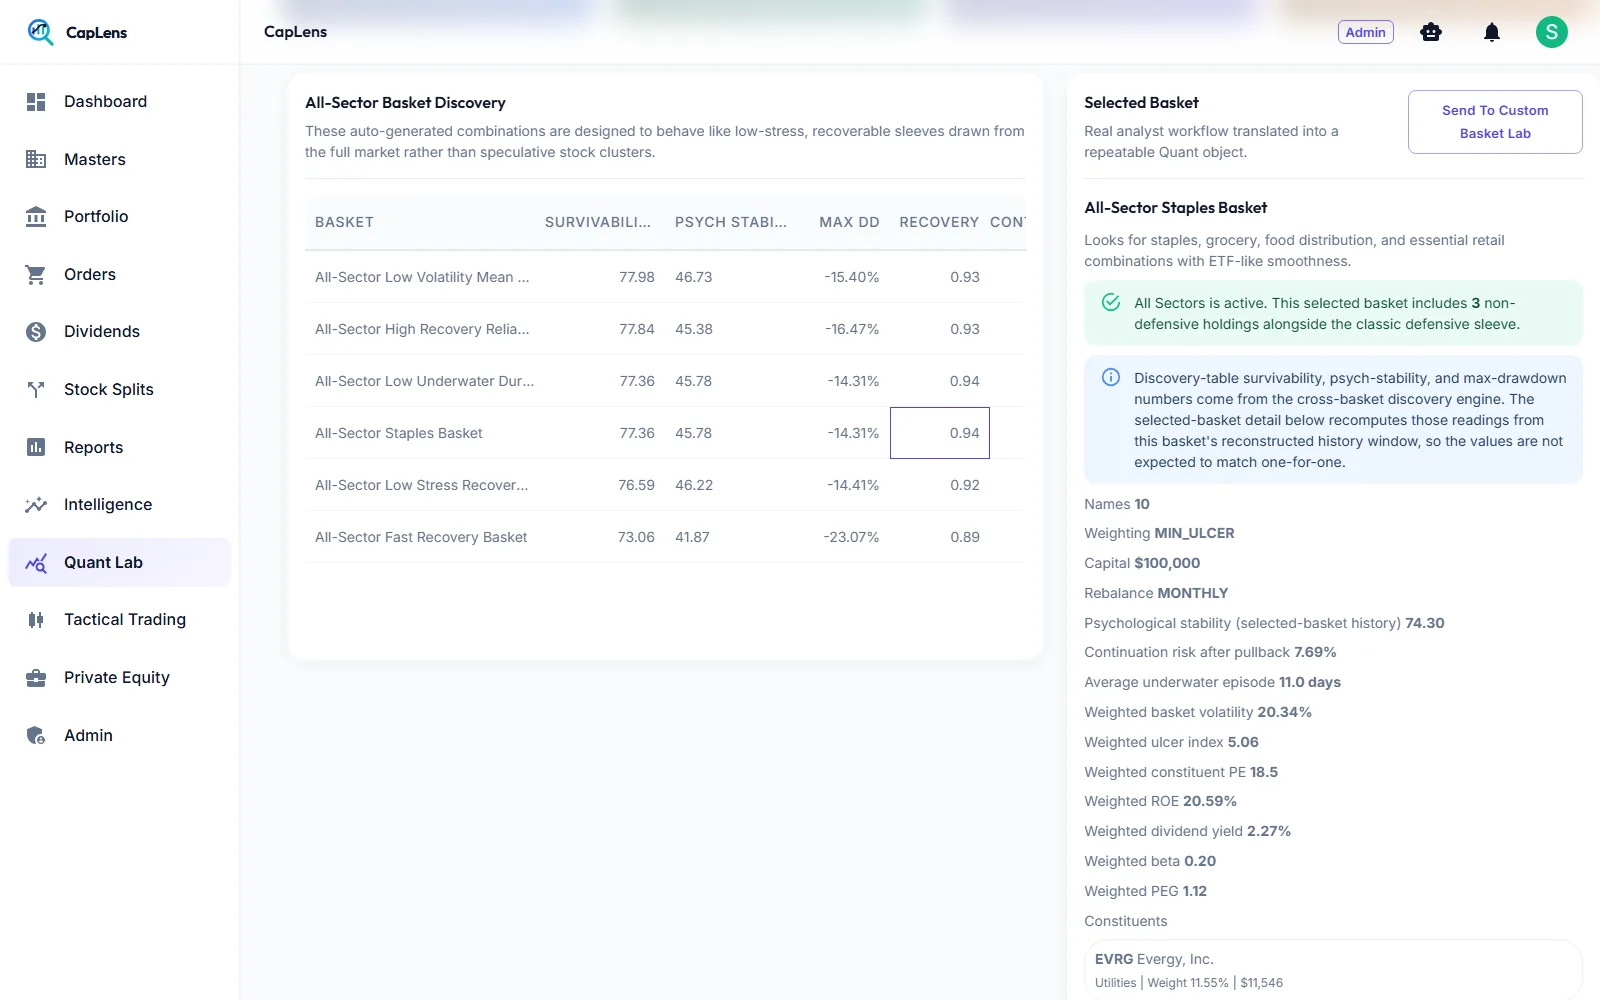
Holdings, weights and fundamentals at a glance
Capital, weighting method, rebalance cadence, psychological stability, continuation risk after a pullback, average underwater episode, weighted volatility and ulcer index, plus weighted PE, ROE, dividend yield, beta and PEG.
Seven views that try to break your idea
A heavier, on-demand validation layer. It asks whether a basket only looked good in one backtest, or still earns confidence under harder evidence.
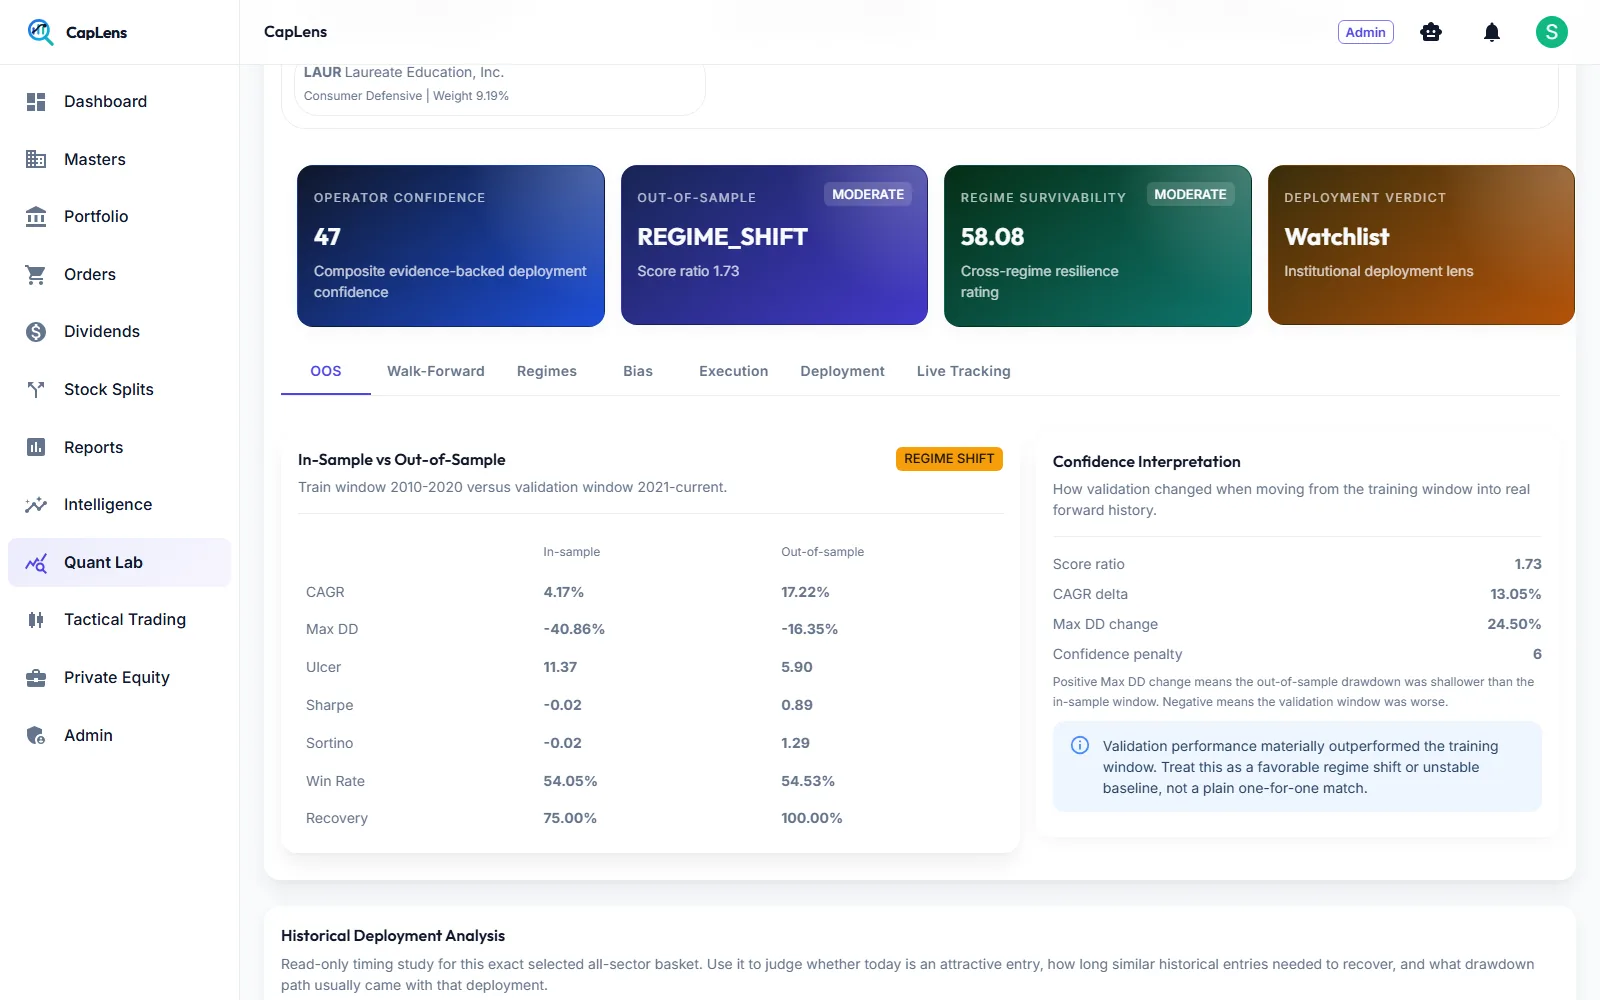
Out of sample
Train versus validation windows compared on CAGR, drawdown, ulcer, Sharpe, Sortino, win rate and recovery.
Walk-forward
Monthly replay across past windows, with confidence calibration by bucket. Shows “not available” when samples are missing.
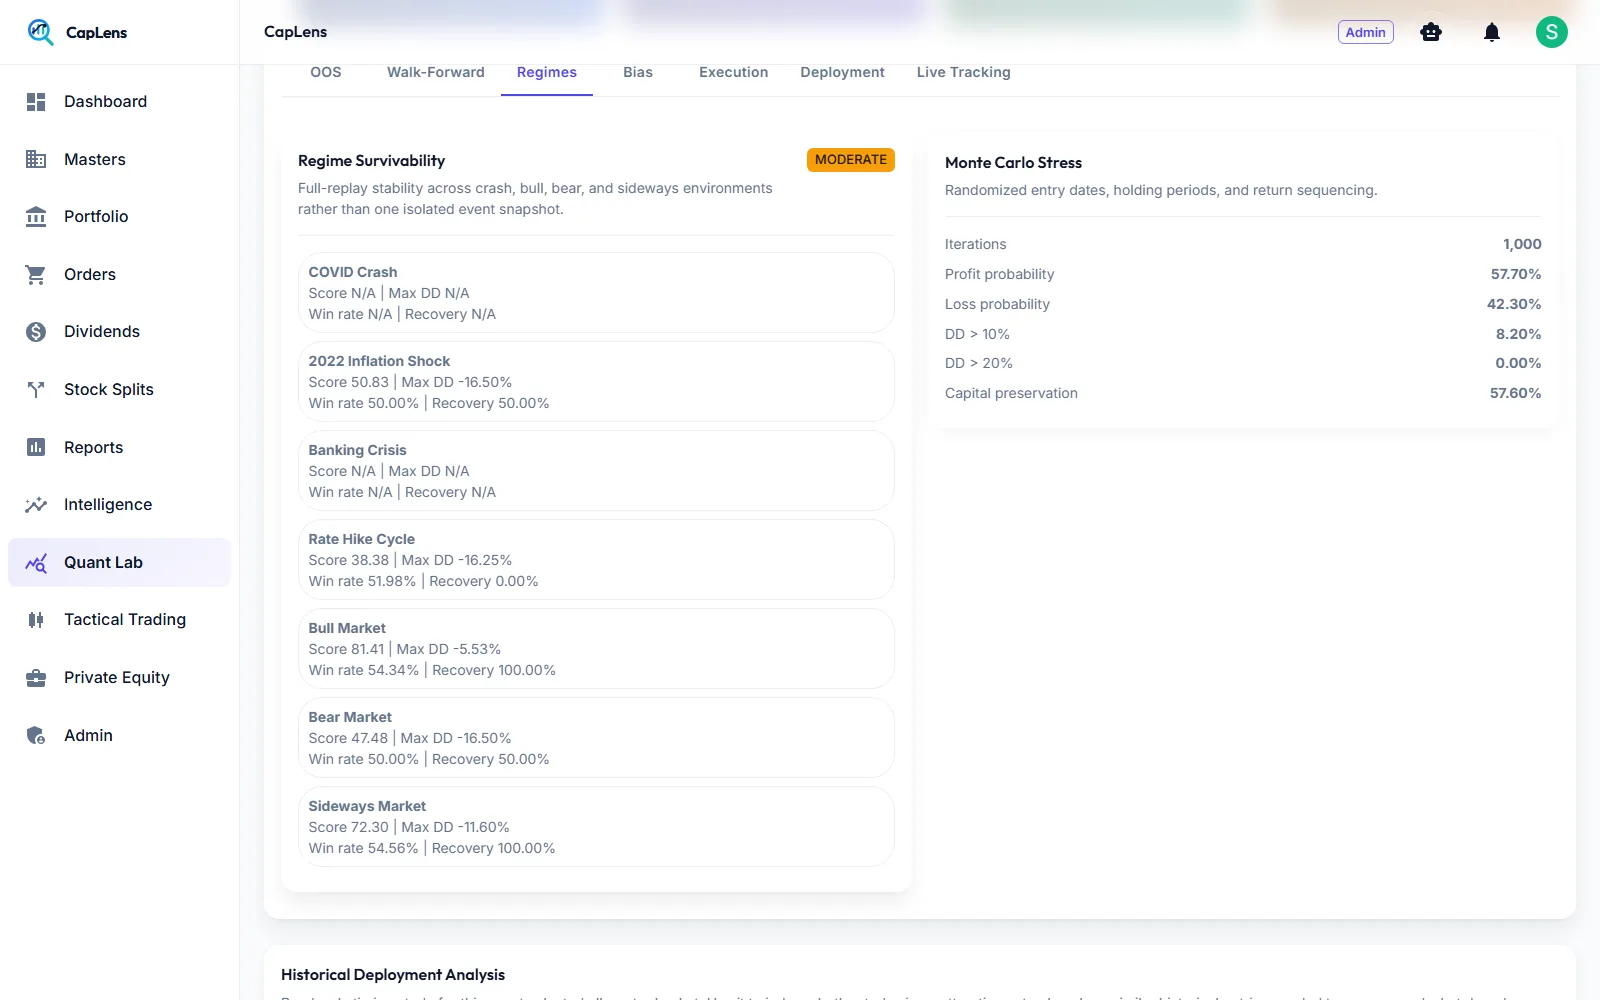
Regimes
Crash, inflation shock, rate cycle, bull, bear and sideways markets, plus 1,000-path Monte Carlo stress.
Bias
Survivorship and look-ahead bias audits with plain-language residual risks.
Execution
Gross versus net return after commission, rebalance cost, slippage and delayed execution.
Deployment and live tracking
An institutional verdict, a deterioration ejector simulation, factor attribution, and drift readiness for ongoing tracking.
When evidence is thin, CapLens says so instead of hiding it. That honesty is the point.
Is today a good entry? How long did similar entries take?
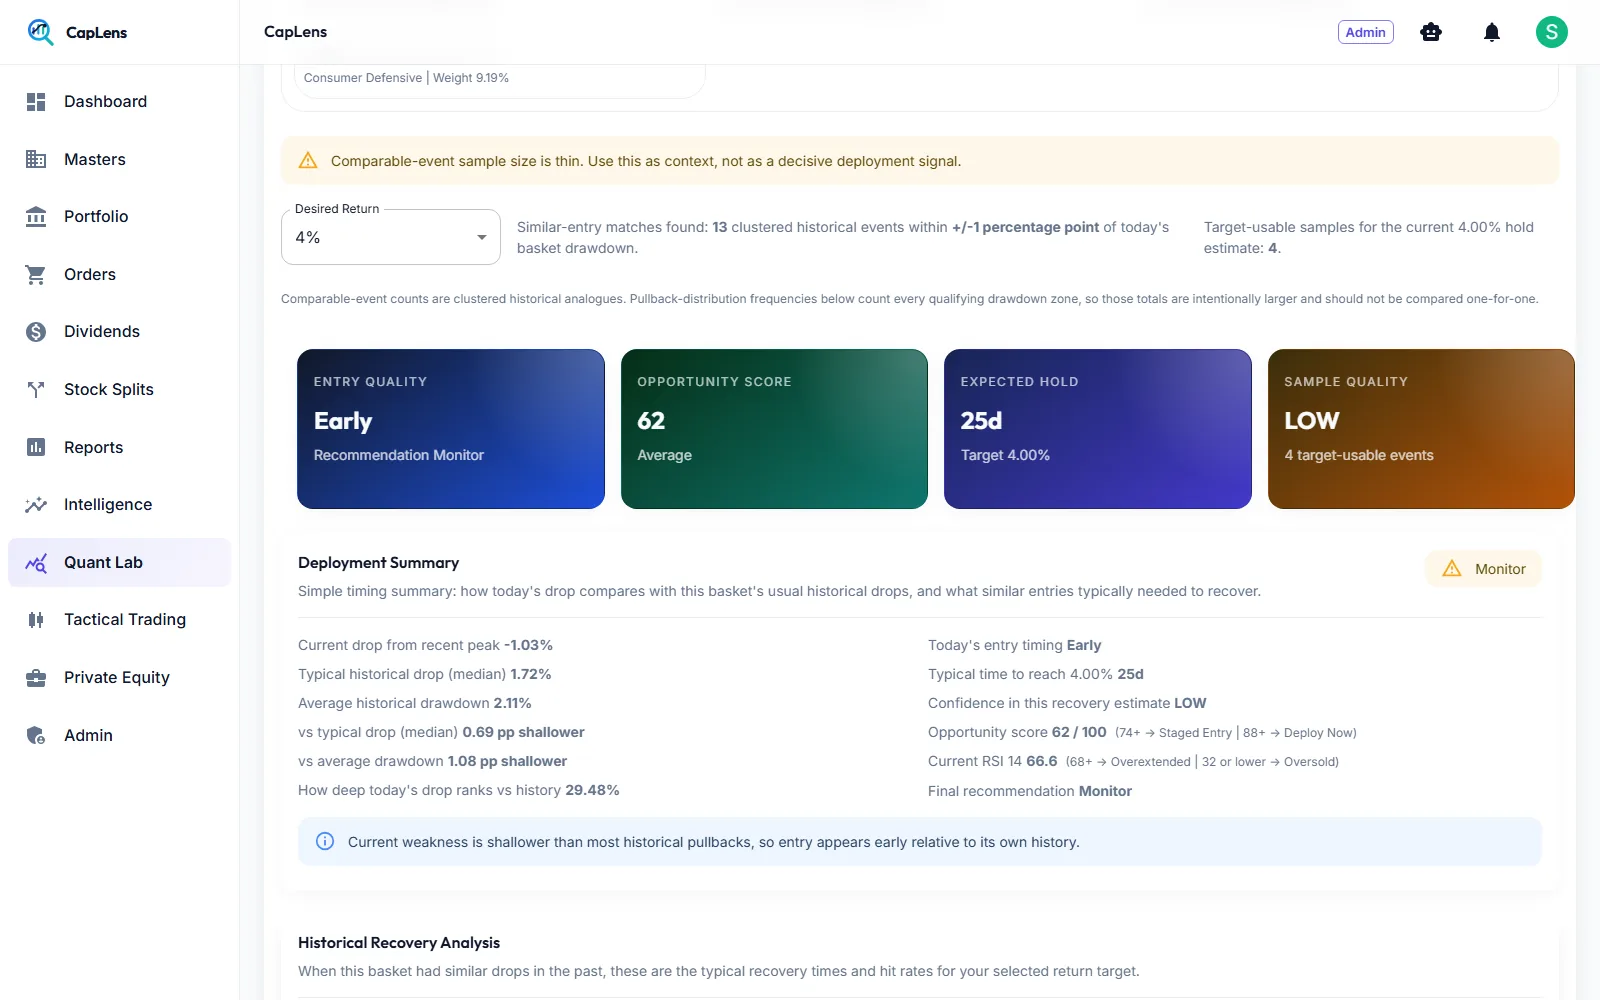
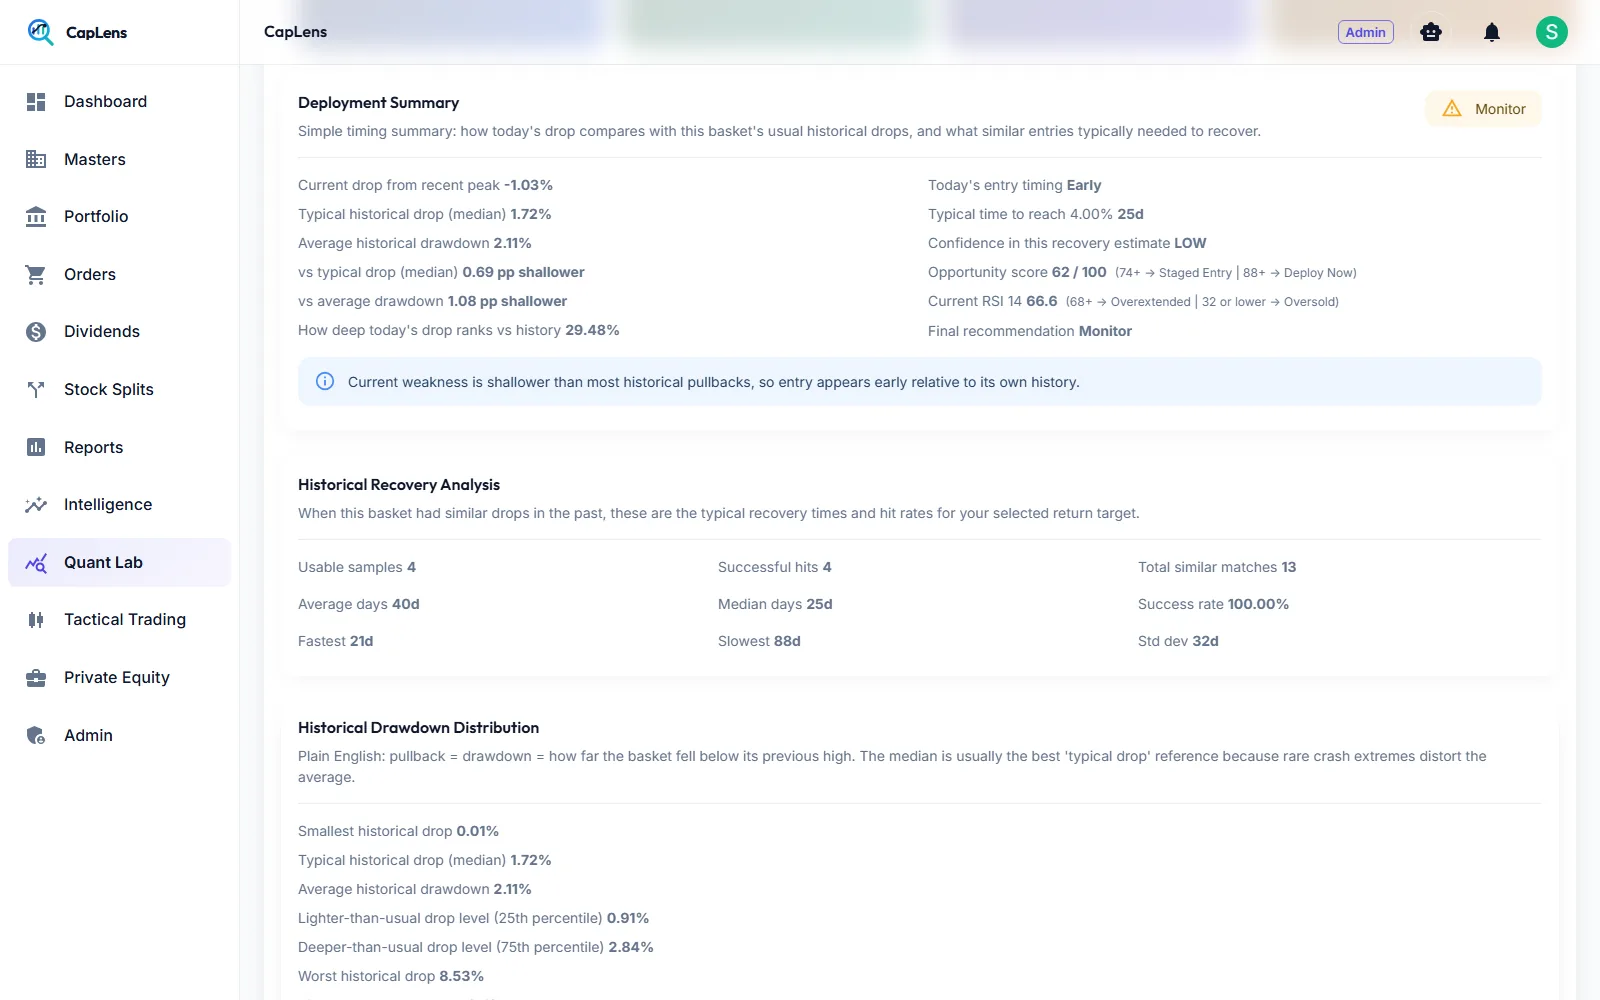
A read-only timing study for the exact basket on screen. Choose a target return and CapLens finds clustered historical analogues, then reports entry quality, an opportunity score, the expected holding period and the quality of the sample behind it.
- Deployment summary versus typical historical drawdowns
- Time-to-target statistics from 1% to 10%
- Probability of success by holding window
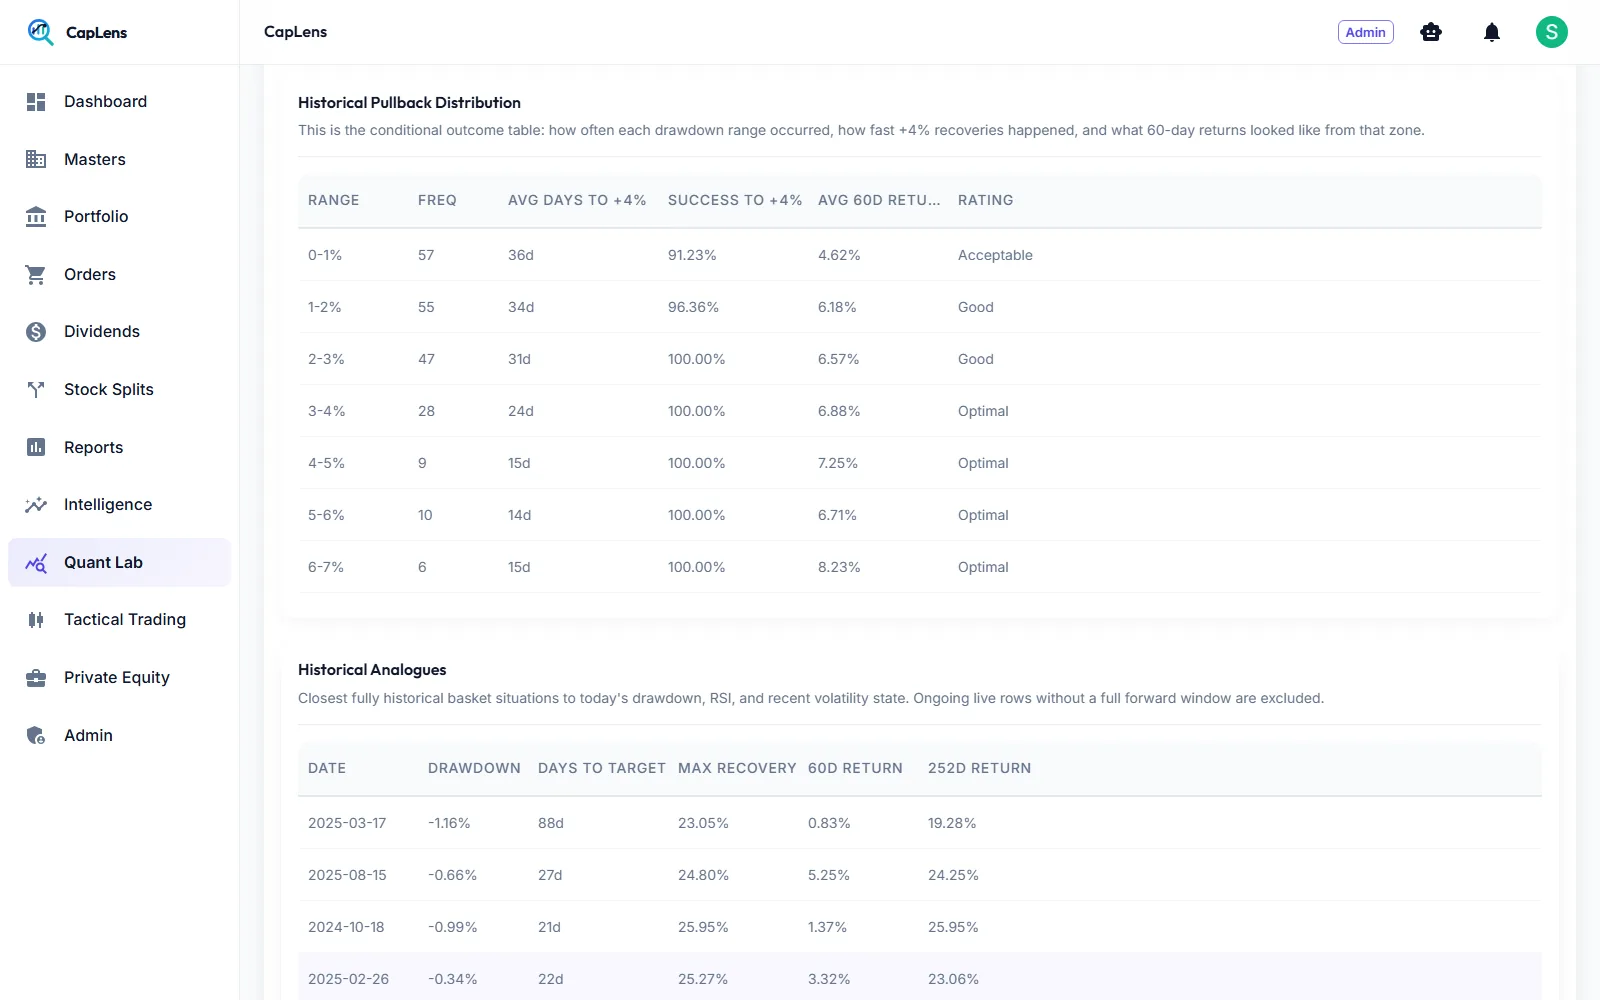
- Pullback distribution with recovery rates and ratings
- Closest historical analogues by date, drawdown and return
See why names were accepted, and why they were not
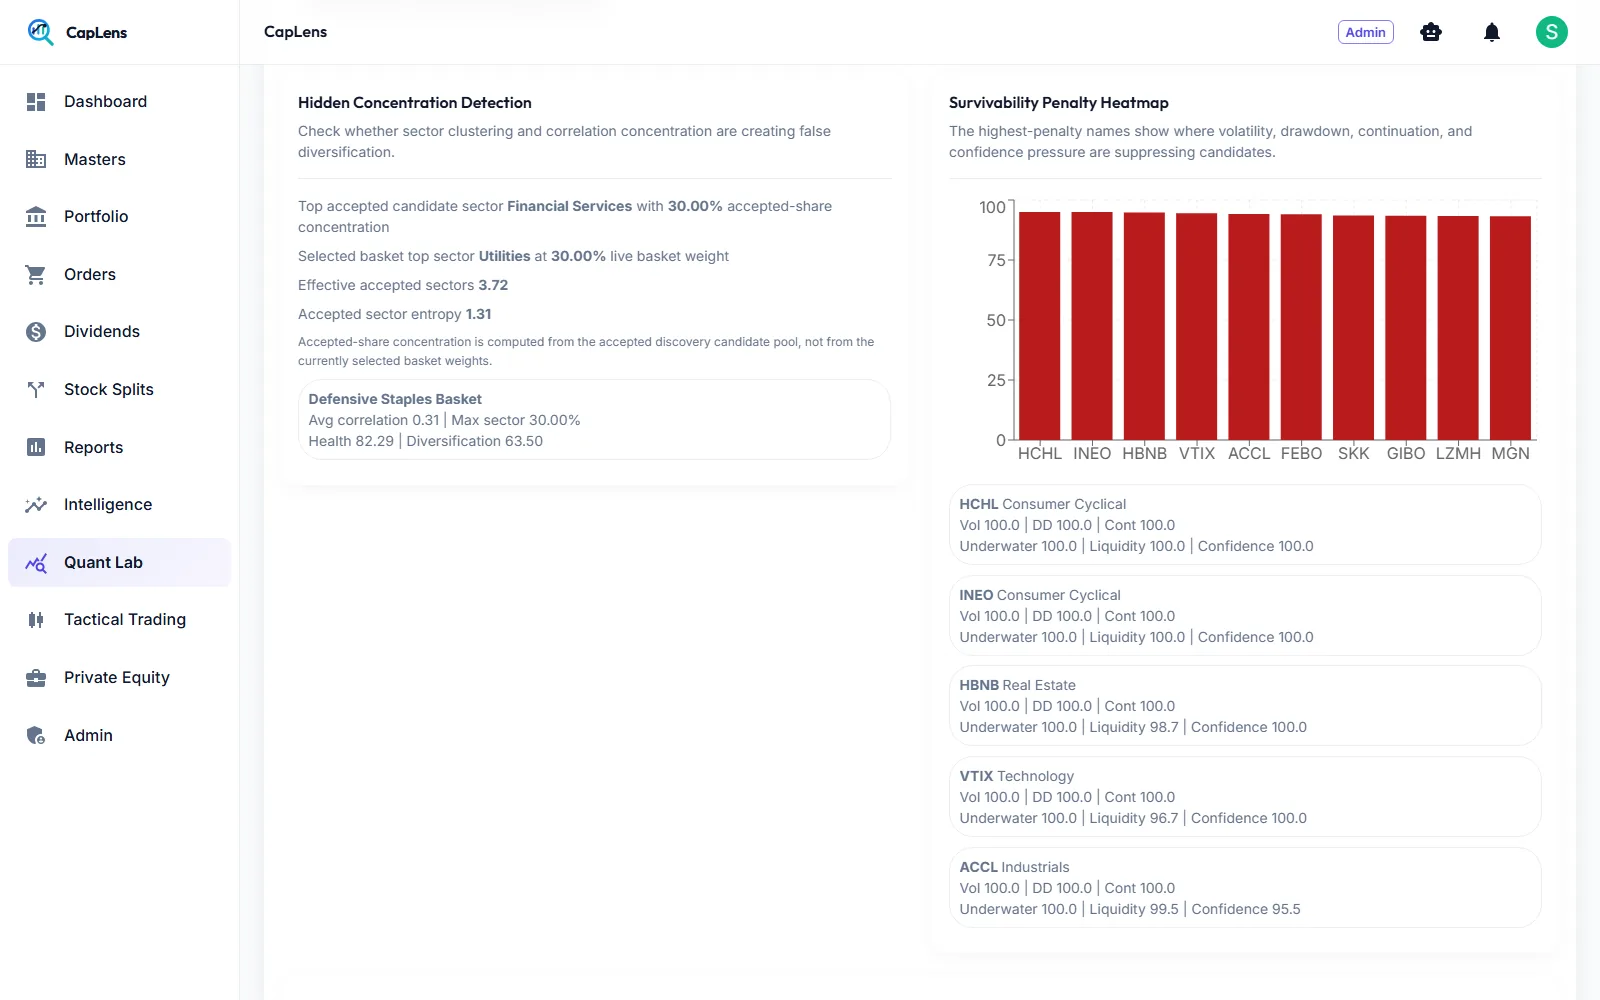
Quant Lab audits its own discovery process, so surprising concentration or over-restrictive rules are visible.
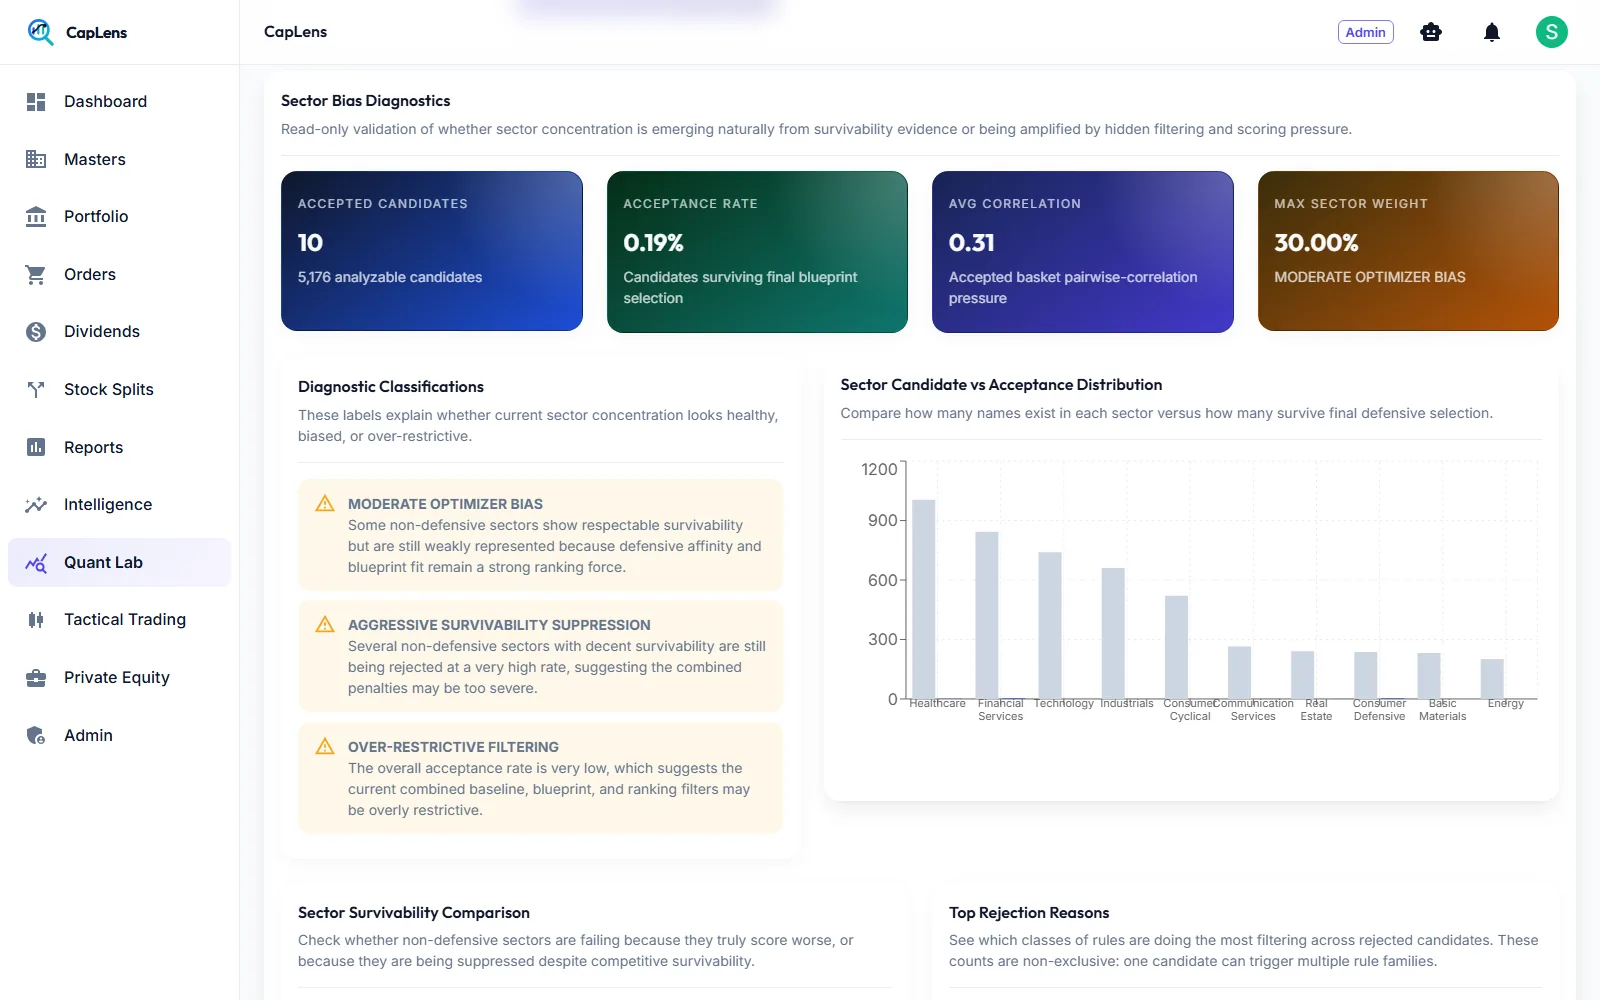
- Sector bias classification: healthy, optimizer bias or over-restrictive
- Top rejection reasons across all rejected candidates
- Fairness validation for strong non-defensive names
- Hidden concentration and false-diversification checks
- Survivability penalty heatmap by factor
- Scoring contribution for every accepted candidate
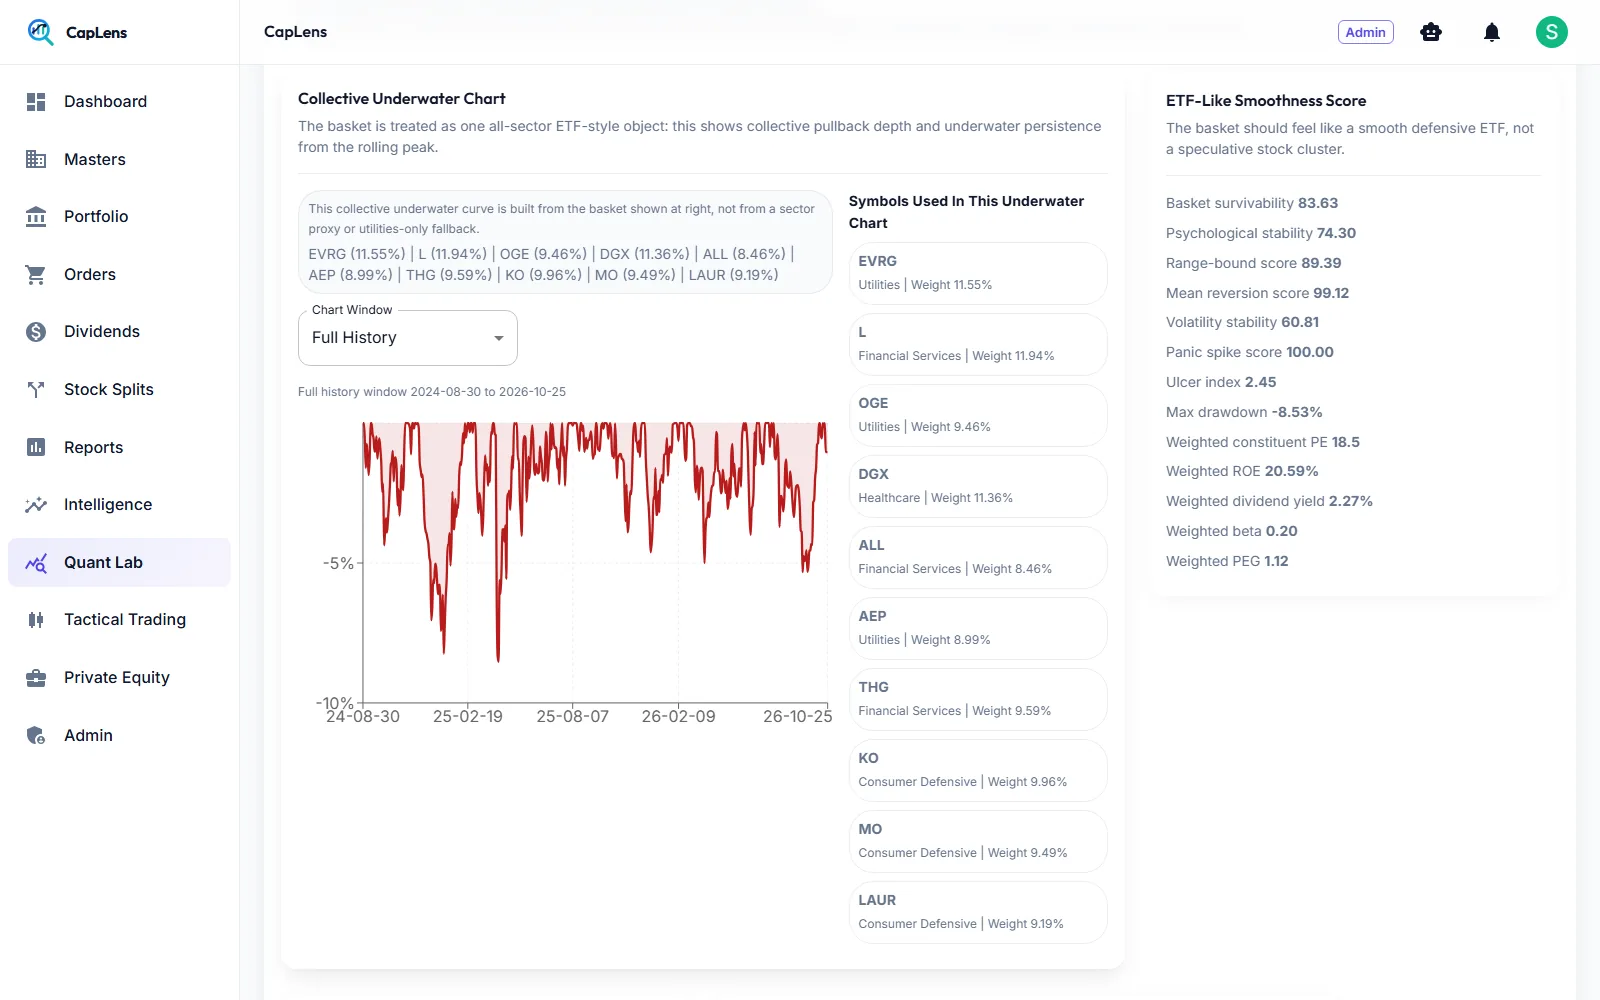
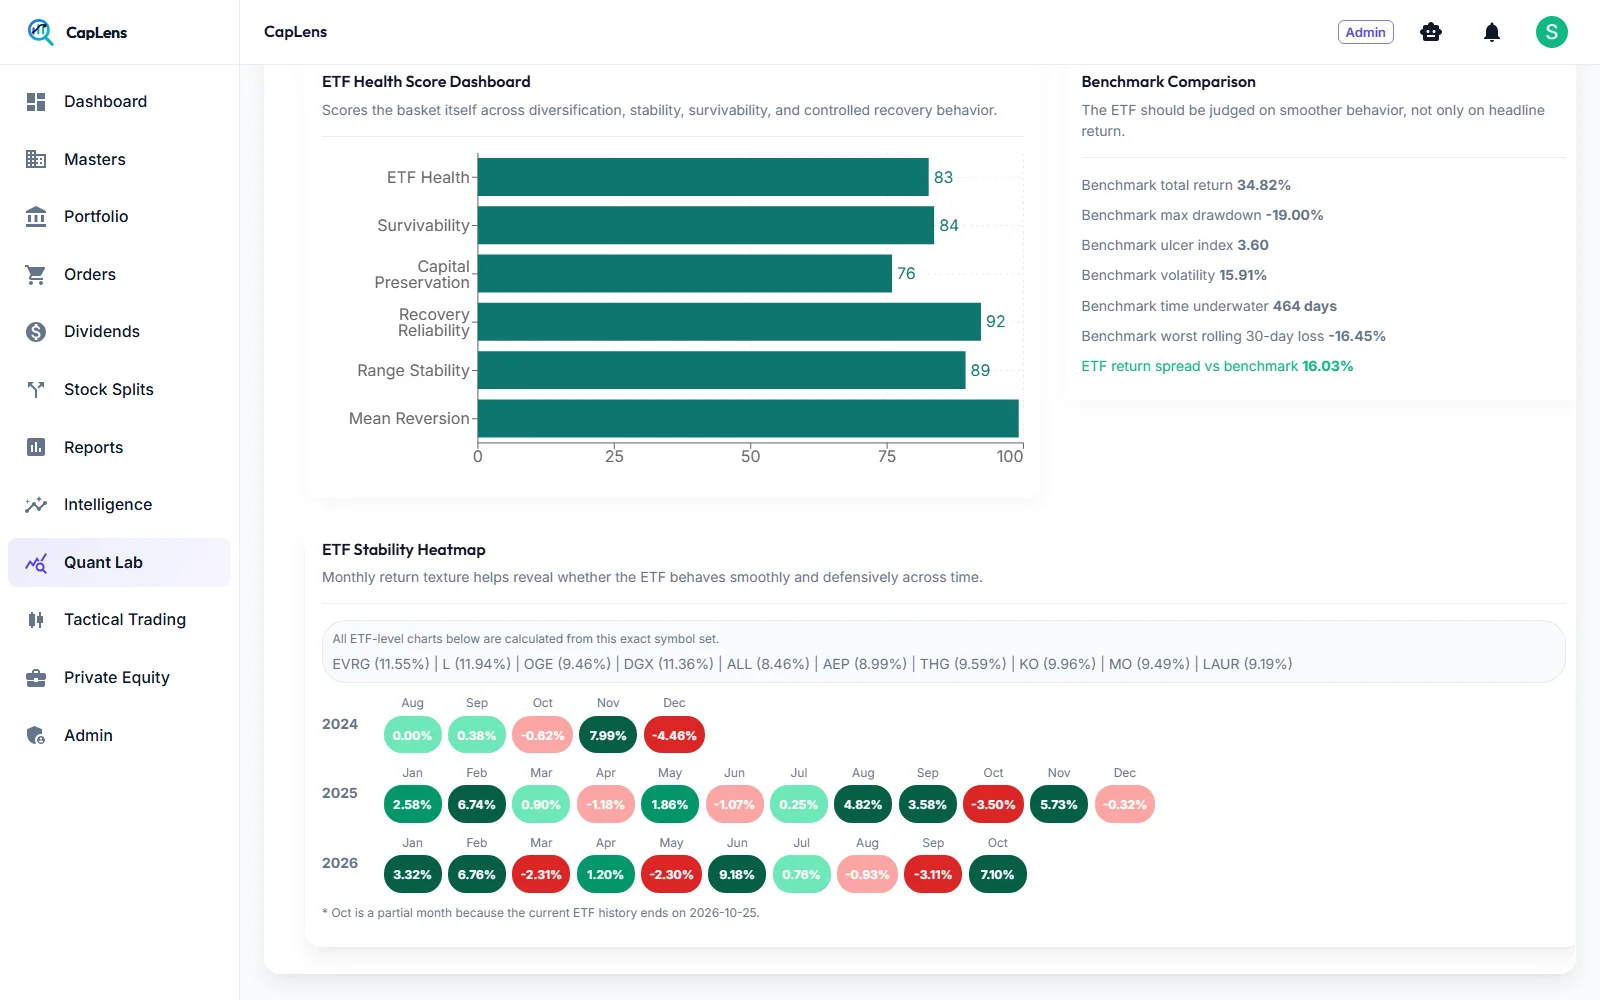
Judge the basket as one ETF-like object
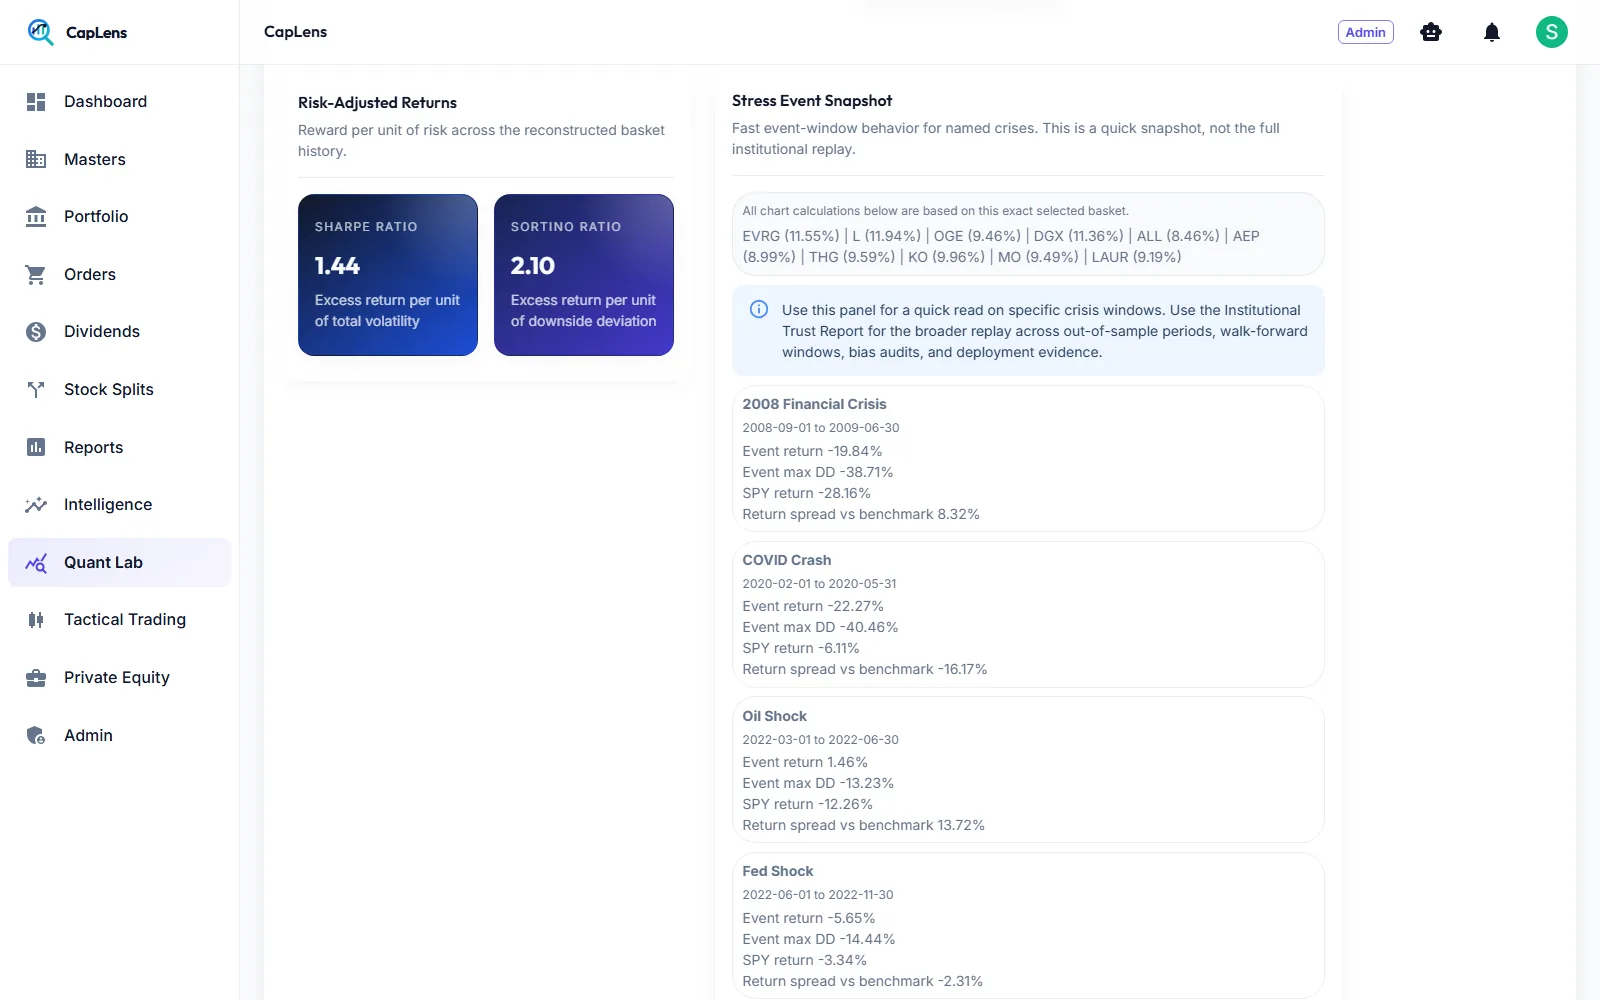
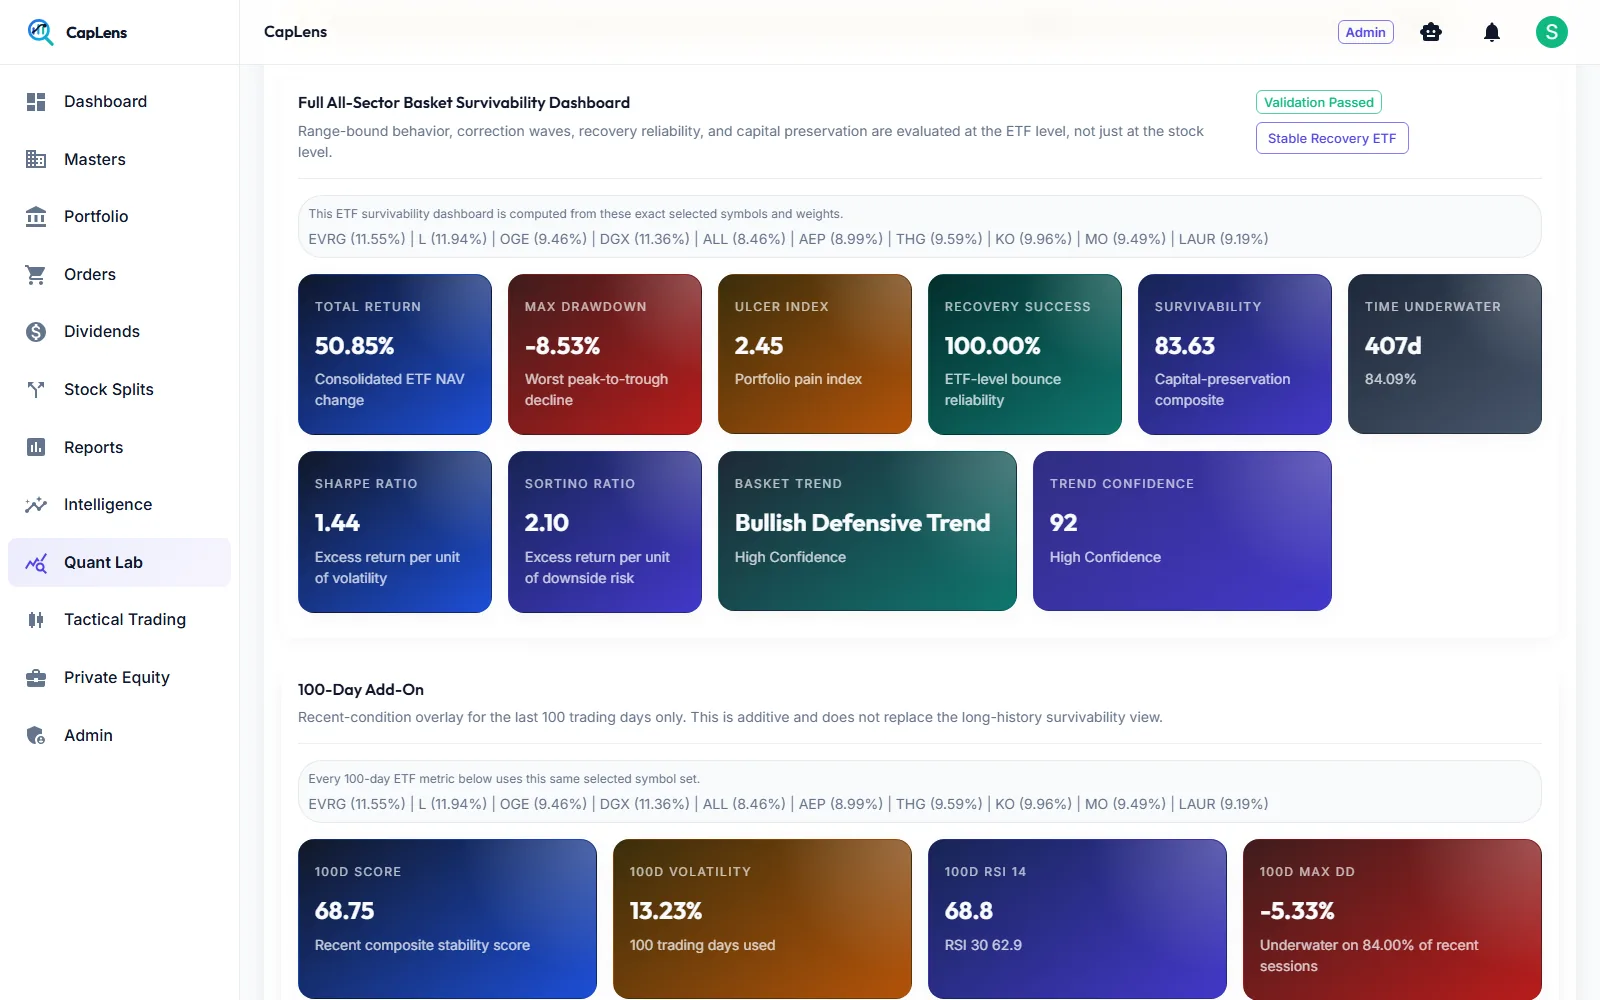
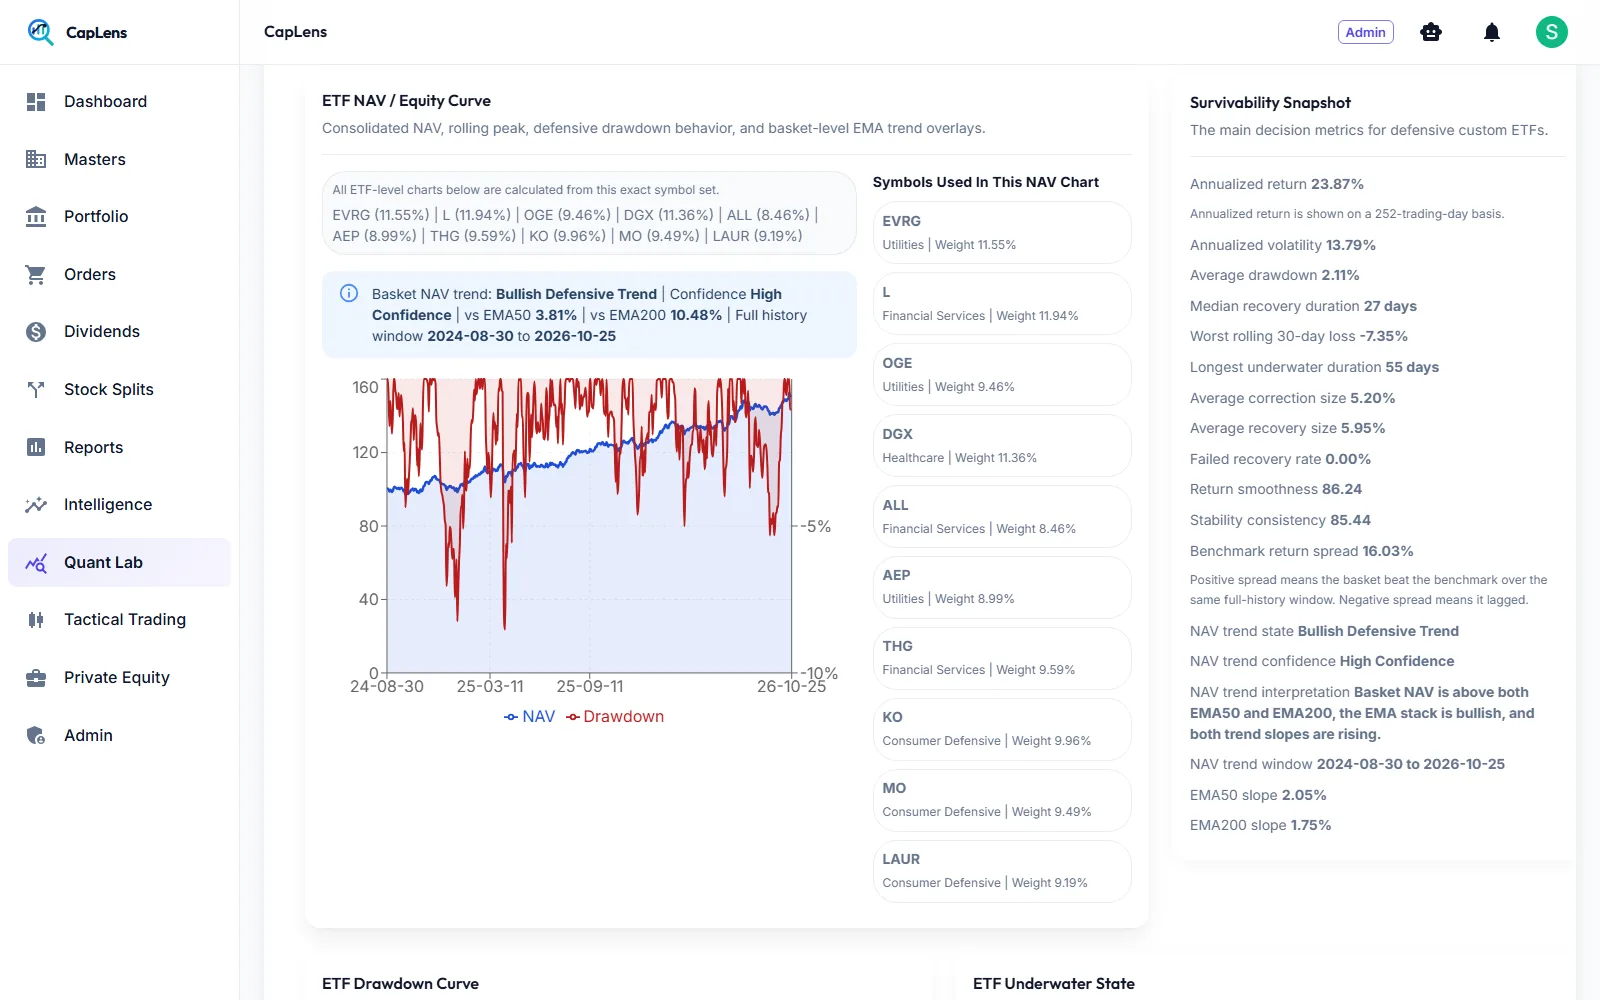
Collective underwater charts, an ETF-like smoothness score, risk-adjusted returns, named stress events, recovery maps and benchmark comparisons, all computed from the exact selected symbols and weights.
- Underwater depth and persistence across 5 to 100 trading days
- Stress windows: 2008, COVID, oil shock, Fed shock, banking panic, Iran conflict
- Benchmarks such as SPY, QQQ and XLP side by side
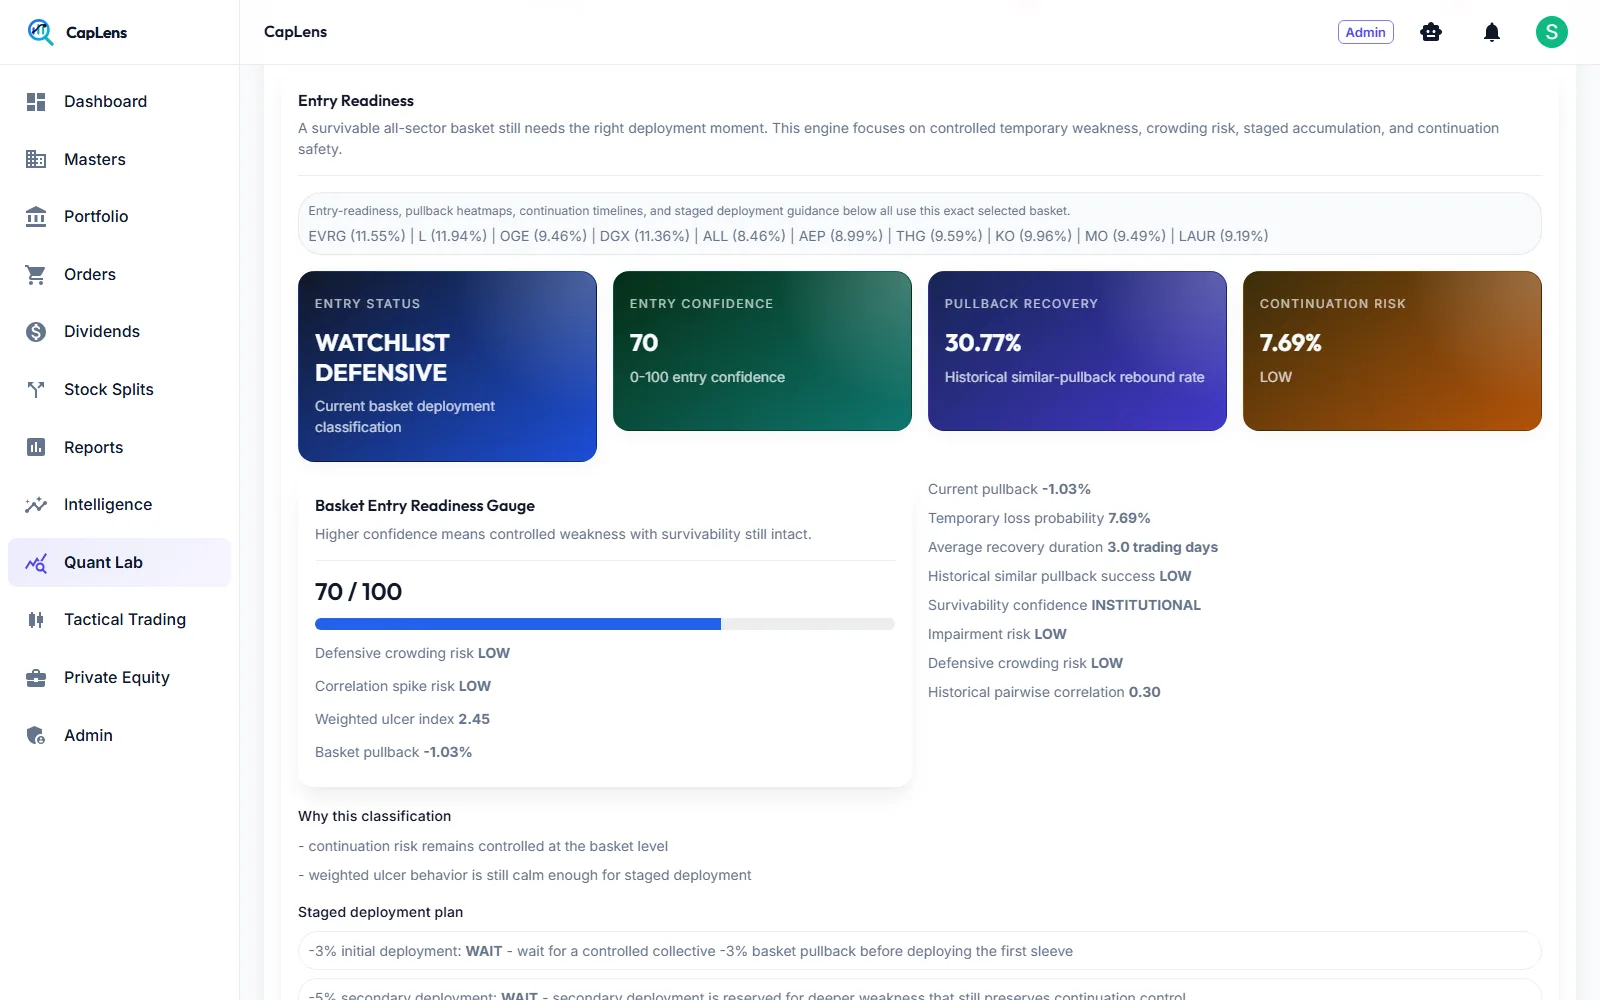
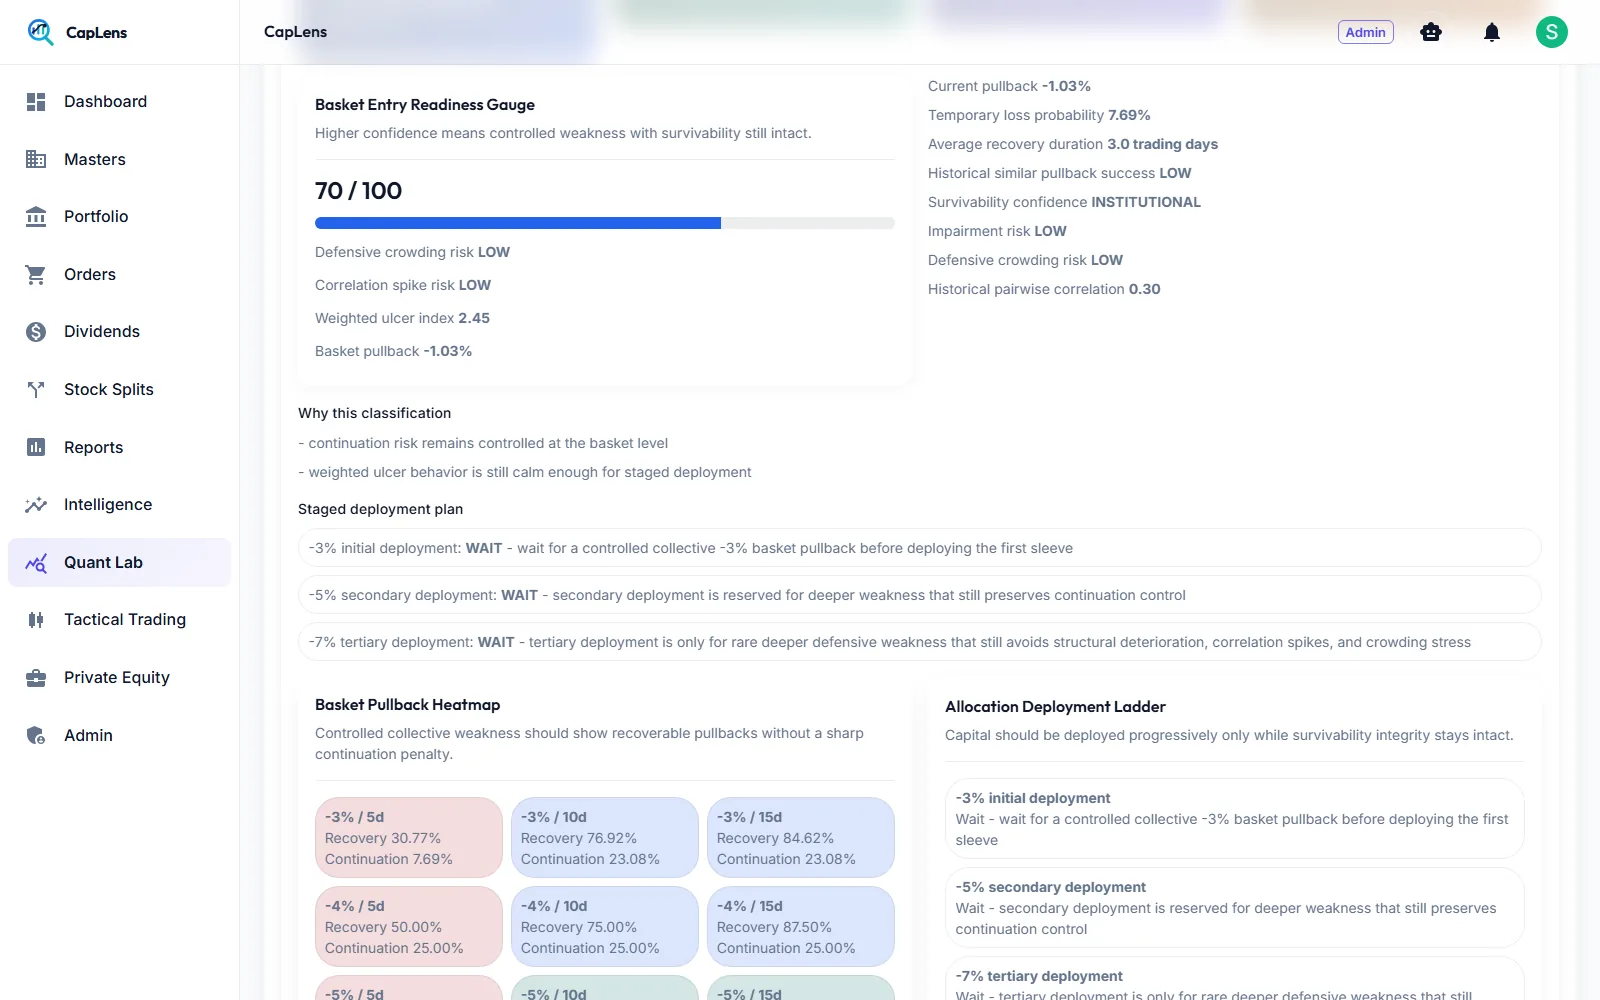
Deploy in stages, only while the evidence holds
A readiness gauge combines pullback depth, continuation risk, crowding and correlation, and a staged deployment plan sets pullback triggers for each tranche. A recent-condition overlay and 100-day add-on check that today still supports the idea.
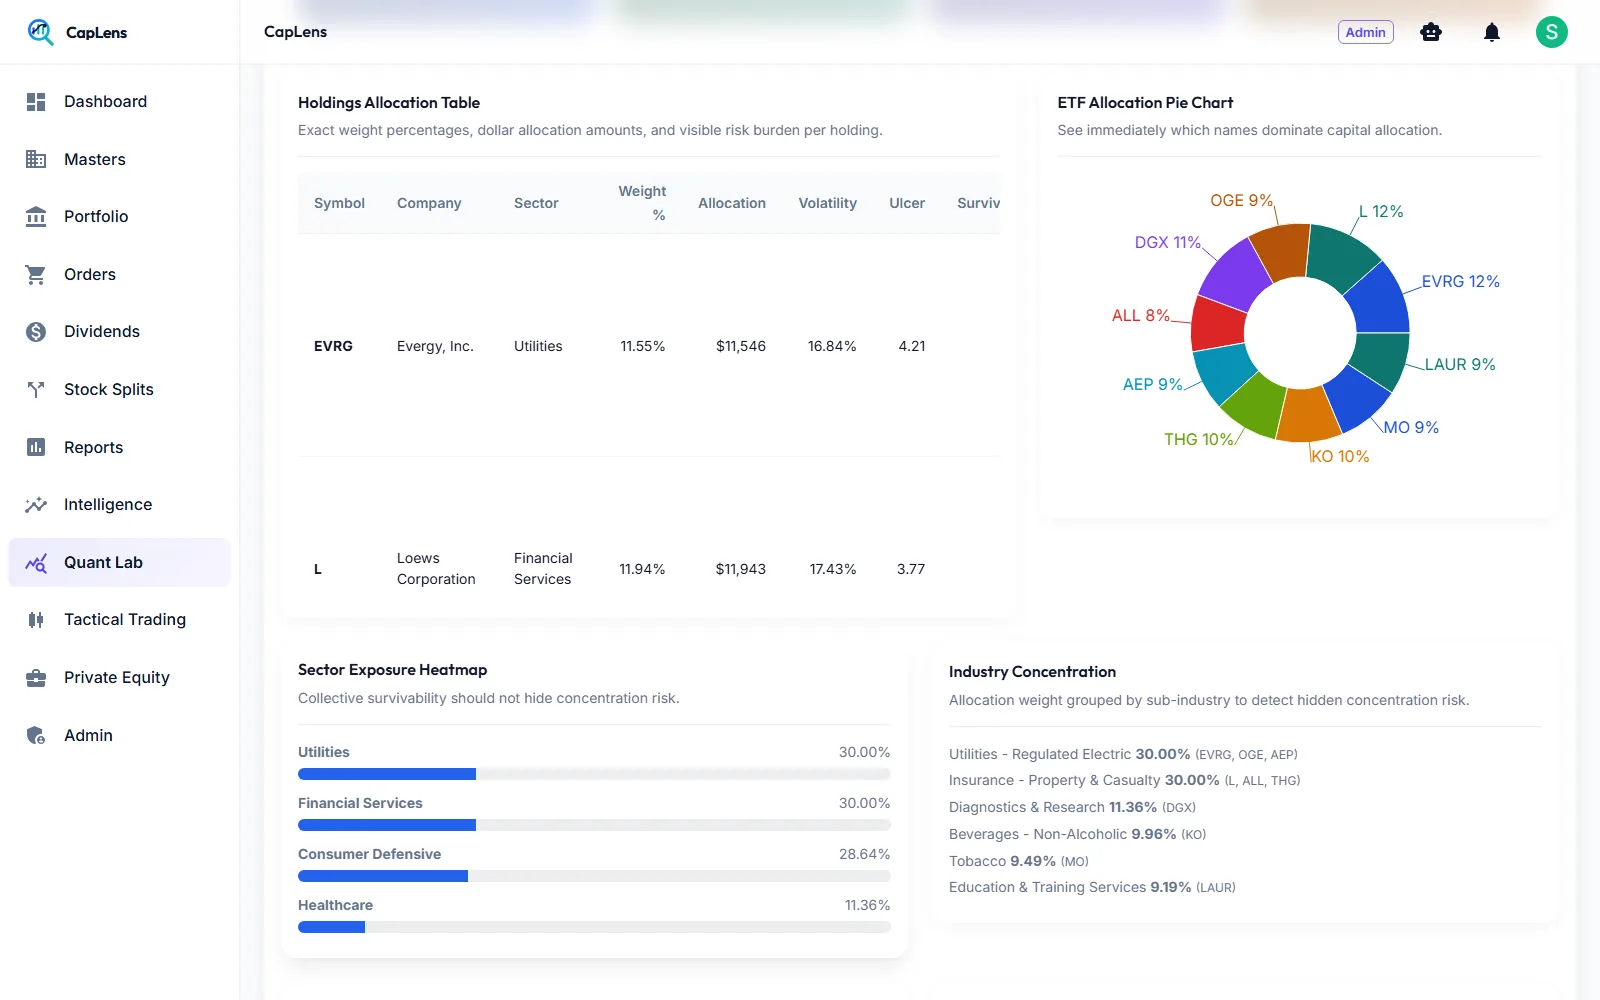
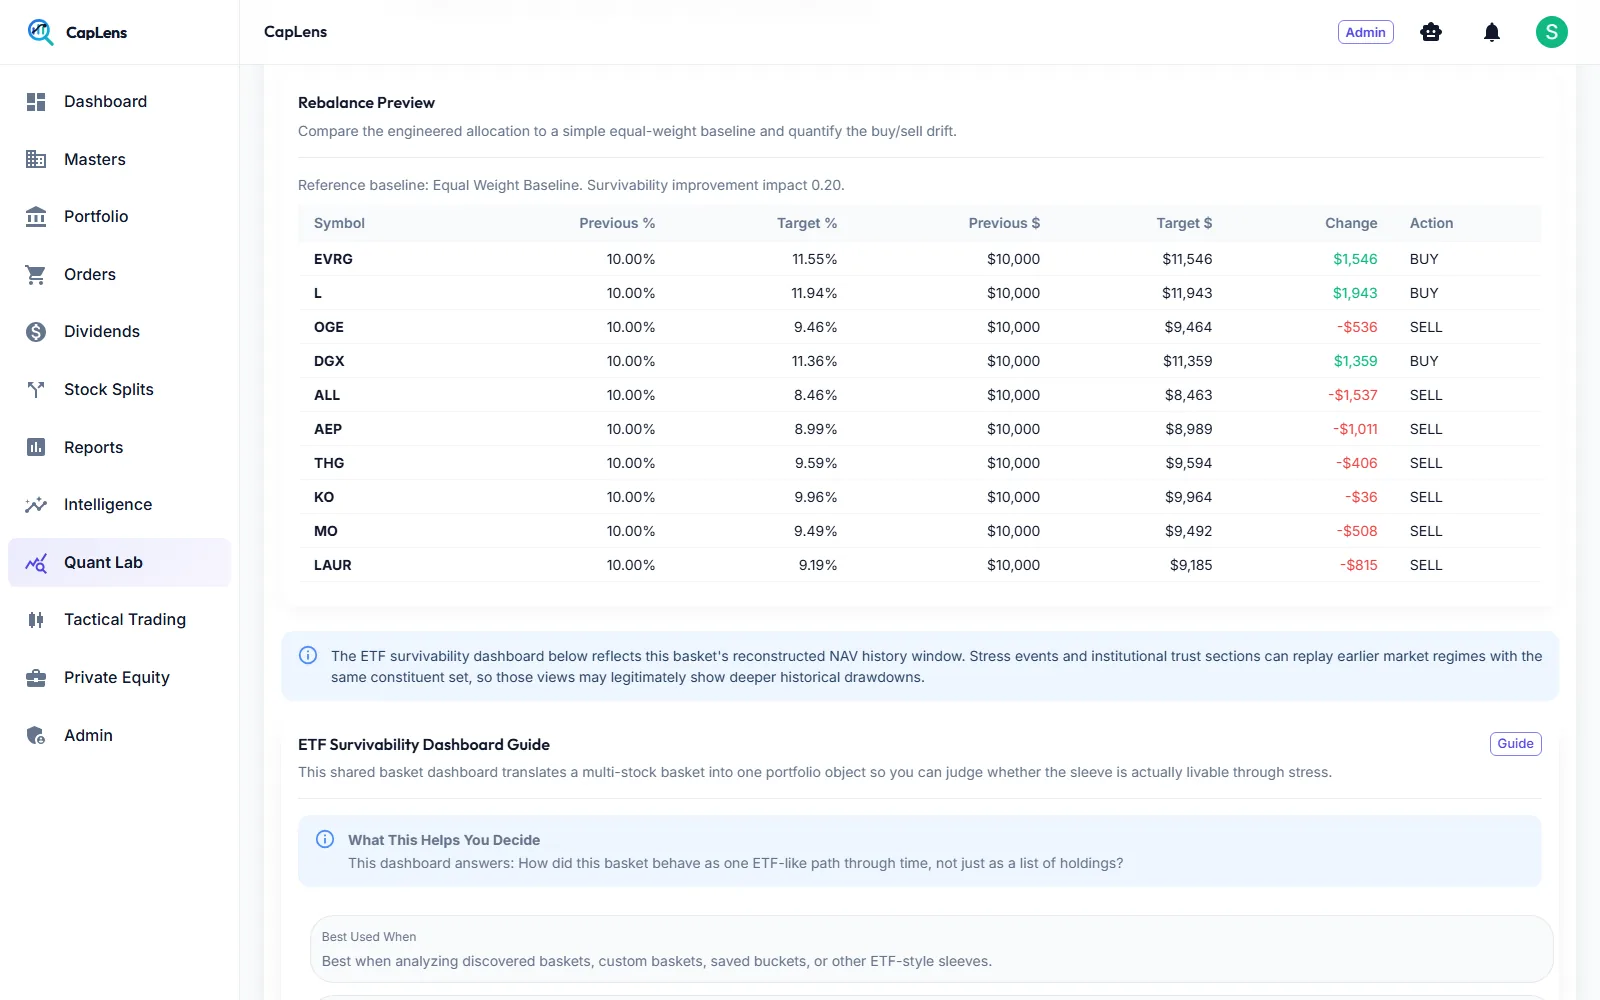
From idea to order sizes
Every holding’s weight, dollar allocation, volatility, ulcer, survivability and risk contribution, with the reason it earned its weight, plus a rebalance preview against an equal-weight baseline with exact buy and sell amounts.
The terms on these screens, explained
- Drawdown
- The fall from a previous high to a later low, shown as a percentage.
- Underwater period
- How long a basket stays below its previous high before it recovers.
- Ulcer index
- A single number for how deep and how long the dips were. Higher means a more painful ride.
- Survivability score
- CapLens’s score for how well a basket withstands and recovers from falls.
- Psychological stability
- CapLens’s score for how comfortable the basket is to hold: fewer deep, long dips.
- Out-of-sample test
- Testing on a period the basket was not selected on, to see if the result holds up.
- Walk-forward test
- Repeating the select-and-test process month by month through history.
- Market regime
- A type of market environment, such as bull, bear, sideways, crash, inflation shock or rate cycle.
- Survivorship bias
- Only looking at companies that still exist today, which makes history look better than it was.
- Look-ahead bias
- Accidentally using information that was not yet known at the time being tested.
- Monte Carlo
- Many randomised simulations of possible futures (1,000 paths here) to see the range of outcomes.
- Execution drag
- Return lost to commissions, rebalancing costs, slippage and delayed trades.
- Staged deployment
- Investing in tranches, each triggered by a pullback, instead of all at once.
See Quant Lab on your own filters
Bring the constraints you actually use and we will run discovery, trust report and deployment study live.